What Three Indicators Say About The Economy
15 July 2022
Happy Friday, The Investor’s Podcast Network Community!
Welcome back to We Study Markets 😁
Stocks closed down again yesterday, but don’t let that hold you back from enjoying a nice start to your weekend.
We are playing a sad song on the world’s smallest violin for BlackRock, the largest asset manager in financial markets, who has seen their assets under management fall from over $10 trillion to now just $8.5 trillion 🎻
Today, we’ll also be discussing mixed signals in the economy, Treasury troubles, JPMorgan’s dismal quarter, the Powell pivot, and much more, in just 4.5 minutes to read.
Read on 📖
IN THE NEWS
👇 Twenty-year Treasury bond troubles (FT)
Explained:
- Despite the uniformity with which many speak of Treasuries, for bond market pros, there’s considerable variation between the types of bonds, their maturity, and whether they’re newly issued or ‘off-the-run’, among other things. The twenty-year U.S. government bond has had a particularly tough go of it, as expert Edward Al-Hussainy says, “the twenty-year part of the market is just dead.” The lack of demand from investors for this section of the yield curve has been so weak that it’s creating price distortions and volatile trading.
- Investors are actually paying a premium, comparatively, to own thirty-year bonds, which offers yields lower than their twenty-year counterpart. This is seemingly illogical, though, as investors can now earn a higher return by taking less risk in owning bonds that have a shorter time to maturity. While curve inversion is a known phenomenon when comparing short-term and long-term bonds, such as the two-year and the ten-year, the pattern is perhaps more perplexing when inversion occurs among two sets of long-term bonds.
What to know:
- As yields creep up, this raises borrowing costs for the government, which is ultimately a detriment to the taxpayers responsible for footing that bill. Twenty-year Treasury bonds have been discontinued previously, and if their prices continue to trade abnormally, then the Treasury may choose to do this again, instead of issuing bonds and raising money at more expensive interest rates.
- While the government hoped to use longer-dated bonds to lock in funding for extended periods of time, investor reception is proving poor. As the largest financial market in the world, U.S. Treasury bonds are generally expected to trade smoothly, but cracks in the system highlight that all is not well.
🌊 JPMorgan Chase prepares for rough seas (CNN)
Explained:
- JPMorgan Chase had some bad news for investors after falling short of analysts’ earnings expectations and also announcing they were temporarily suspending share buybacks. Profits declined 28% from the previous year, and the bank reported earnings of $2.76 per share versus the $2.88 that was expected by analysts. The stock has fallen 29% year-to-date. Ouch 🤕
What to know:
- JPMorgan Chase is the largest US bank by assets, and its earning reports are used by investors as a bellwether for Wall Street. CEO Jamie Dimon warned of an economic “hurricane” last month and continues to expect an upcoming recession. He believes rates will go up more than people are anticipating and feels markets will remain volatile.
- However, Mr. Dimon said there were some bright spots. Consumers are still spending money, jobs are plentiful, and wages are going up. He warned, though, that geopolitical tensions, rising inflation, falling consumer confidence, and concerns about how high rates will go, are very likely to have negative consequences on the global economy further down the road.
🤔 Can private markets resist the equity bear market? (Goldman)
Explained:
- Private markets, where investors can lend money to or buy ownership in companies, have doubled in size over the past few years to $10 trillion. This includes private equity, private credit, venture capital, infrastructure, and more. Typically, the firms that invest in these markets must raise money from other investors to fund their activities. “Much depends on the type of investor and the company’s stage of capital raising, though some reports suggest raising private capital is getting more difficult.”
What to know:
- Firms like pension funds have increasingly sought out investments in private markets, to bypass competition in places like the stock market, and find opportunities for investments not normally available to most people. Because these assets are not marked-to-market, meaning they don’t have a price that fluctuates daily in public markets, private markets are particularly attractive in minimizing external pressure, at least in appearance.
- Just because you don’t know at all times how much you could sell your private market investment for, doesn’t mean they are immune from the influence of financial market turmoil generally. As interest rates rise and the economy slows, fundraising for private market investments is likely to further drop, and with that, valuations of those assets would fall as well eventually.
SPONSORED BY
How do you make sure that you are investing with a “good” operator?
Dan Handford and his wife are currently invested in 54 different passive real estate syndications with 16 different operators in 10,000+ doors.
They use this exact list when deciding whether or not to invest with a particular group. Get access to the “7 Red Flags for Passive Real Estate Investing” to be confident in your next investment!
DIVE DEEPER: A tale of three indicators
Not all data points are created equal, and there are different sorts of indicators investors can use to paint a picture of the economy at a moment in time.
For insights into how things are going right now, we looked to one of our favorite investors from the great country of Italy, Alfonso Peccatiello.
He discusses the three types of indicators he uses: lagging (tells about something that’s previously happened in the economy), coincident (reflects an immediate change in the economy), and leading (anticipates future outcomes).
This week, we received key data points for each type of indicator that we can use to understand where the economy has been, where it is now, and where it is likely to go.
So what?
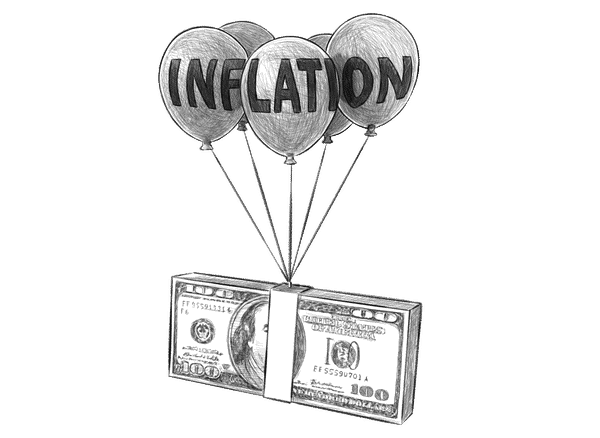
Our lagging indicator, last month’s inflation report, paints the story of an economy with rapidly accelerating prices, fueled by supply chains and production that cannot match consumer demands following pandemic reopening.
Overall, inflation is broad, and very few parts of the economy have resisted its effects, while other parts have seen multi-decade record price increases. This is extremely disturbing not just to consumers, that is, all of us, but also to the Federal Reserve, who is tasked with controlling outbursts of inflation.
While this June report is important and concerning, it ultimately conveys activities that have already transpired.
We also have a coincident (slightly lagging) indicator to review in the recent jobs report which appears reasonably strong. Last month, 342,000 jobs were created in the U.S. economy. In normal times, this would likely be a sign that the economy is quite healthy, and the indicator is considered to be less lagging, because these new workers are unlikely to be suddenly laid off after just a few weeks.
Beneath the surface, though, Alfonso highlights that during this period the number of people employed relative to the total working age population (everyone between 25 and 54 years old) actually declined. So fewer of these prime working-age Americans are employed, and he uses this ratio as a means for predicting the top in an economic cycle. In each of the past three recessions, when this ratio hit 80%, a recession soon followed, and just recently, it appears we have peaked at 79.8%.
In this regard, the current economic picture is blurrier – is the labor market actually developing strongly, or is it poised to begin reversing after a peak in the employment-to-population ratio?
Lastly, Alf points out a recent leading indicator that may tell us just how inflation and employment uncertainties are set to unfold.
After a survey from the National Federation of Independent Businesses (NFIB), which is addressed to roughly 800 small companies nationwide, the outlook for economic growth is quite poor. In terms of their expected sales volumes (number of units sold, not dollar value of sales which is distorted by inflation), these are at their lowest levels since 2009.
The Takeaway?
While the Federal Reserve responds harshly to lagging indicators of elevated inflation, more current and leading indicators suggest that business activity may actually be slowing down meaningfully already.
If fewer working-age Americans are employed, and small businesses are bracing for huge drop-offs in real sales, it’s possible that this inflationary spike proves transient, and price acceleration would fade as things naturally slow down.
As the Fed slams the brakes for everyone, it’s important to consider the ramifications for the economy, should it be true that they’re raising interest rates into a weakening environment.
In the past, central banks have primarily done this only when the economy was genuinely strong and growing rapidly, so as to moderate the business cycle.
For Alf, he’s betting on long-term bond yields to fall, as he anticipates that the Federal Reserve’s aggressive rate hiking agenda will set back economic growth in the U.S. for years.
Since long-term bond yields tend to reflect inflation and growth expectations, yields would then correspondingly drop (bond prices rise) if this proves true.
Essentially, as the economy stagnates, investors seek long-term government bonds to own and bid these prices up, as opportunities elsewhere fade away (earnings growth slows in a recession for stocks, so equities may underperform generally).
Let us know what you think by hitting reply to this email – how are you investing in response to the Fed’s moves?
And if you enjoy our industry-leading podcasts like We Study Billionaires, Bitcoin Fundamentals, and Richer, Wiser, Happier, you can subscribe to listen to our entire catalog of these shows and episodes, without ads, through Apple Podcasts for just $2.99/month.
“Powell is channeling his inner Volker, and he is indicating he really is serious. I think he can’t pivot immediately. He just can’t. He knows his credibility would be blown apart.”
Meaning
In Lawrence’s recent interview on Bitcoin Fundamentals with Preston Pysh, he discusses the current macroeconomic environment, and leaves this comment about Jerome Powell, the current chairman of the Federal Reserve, in referencing his responsibility for raising interest rates in the United States.
In terms of channeling his inner Volcker, who was a past chairman of the Fed in the 1980s and is famous for ‘breaking the back’ of inflation through high interest rates, Jerome Powell has recently made known his commitment to a similar strategy.
For central banks, perception is a pillar of their policy success. In other words, if people don’t believe they’re serious in their intentions, then this alone may counteract plans to change financial conditions in the economy.
And Powell’s credibility has been seriously called into question lately, following his plan to raise interest rates in 2018, which was cut dramatically short by turmoil in equity and treasury markets.
So many are wondering, will Powell pivot again from raising interest rates?
Higher rates are likely needed to combat inflation, but it’s uncertain to what extent and how much pain in markets the Fed is willing to tolerate before deviating from their current plans.
Lawrence’s thoughts here emphasize Powell’s awareness that he must be particularly firm this time around, or he risks permanently staining the Federal Reserve’s credibility, which could prove disastrous to their ability to moderate and stimulate the economy going forward.
That said, as leading indicators already point to an impending recession, the necessity of said rate hikes to slow the economy and inflation is unclear. Further hikes may even threaten inducing a severe recession.
So tell us, do you think Powell will pivot again?
Or will the Fed cling to its plan to dramatically raise interest rates throughout the economy?
Just reply to this email to let us know.
WHAT ARE DISCOUNT RATES?

On Wednesday, we discussed the meaning of intrinsic value, and stated the following, “intrinsic value equals the current equity value plus the expected future increases in equity value discounted to today.”
To which some of you wondered, how do you calculate the rate at which you should discount future equity increases (free cash flows) in valuing a stock?
Well, the discount rate, in some sense, is the degree to which you reconcile the future value of money with the present value of money. In other words, it’s your opportunity cost for giving up your dollars today (by exchanging them for ownership shares in a company), in hopes of receiving a greater dollar payout in the future.
The rate you choose to use can be arbitrary, but the essential premise is to find some relatively safe comparison as your starting point, and then increase the rate at which you discount depending on how risky the investment is (the likelihood that you receive your full investment back).
Higher discount rates applied to future dollars equates to lower present values, and the minimum value you should use as a discount rate is that of U.S. Treasuries, usually 10-year Treasury bonds (currently ranging between 2.5 and 4%), plus 4–6% for the extra risk associated with stocks.
This is because companies are less certain to pay you back completely, on both their debt (principal & interest payments) and from owning their equity (share buybacks and dividends), so a higher discount rate can be used to account for this.
However, successful large companies like Apple typically merit a lower discount rate than less profitable and more speculative companies.
For these uncertain bets, a higher discount rate will yield a more conservative valuation, which using that as your guide, may help you avoid a lot of bad bets on companies whose stocks trade above this calculation.
While this process may sound like a science, in many ways, it’s actually an art. Fortunately, we have tools for mathematically estimating a range of per-share intrinsic values depending on your discount rate.
SEE YOU NEXT TIME!

That’s it for today on We Study Markets!
If you enjoyed the newsletter, keep an eye on your inbox for them on weekdays around 12 pm EST, and if you have any feedback or topics you’d like us to discuss, simply respond to this email.
We’ll see you back here again tomorrow – same place, same time 😉

P.S The Investor’s Podcast Network is excited to launch a subreddit devoted to our fans in discussing financial markets, stock picks, questions for our hosts, and much more! Join our subreddit r/TheInvestorsPodcast today!
